
A slow application does more than frustrate users. It can increase bounce rates, reduce conversions, consume unnecessary infrastructure resources, and make an otherwise reliable application feel unreliable.
Even small performance improvements can make a noticeable difference. Application speed is a crucial aspect of both user experience and business performance, as the 1-second delay can cost 7% in conversions benchmark is frequently cited.
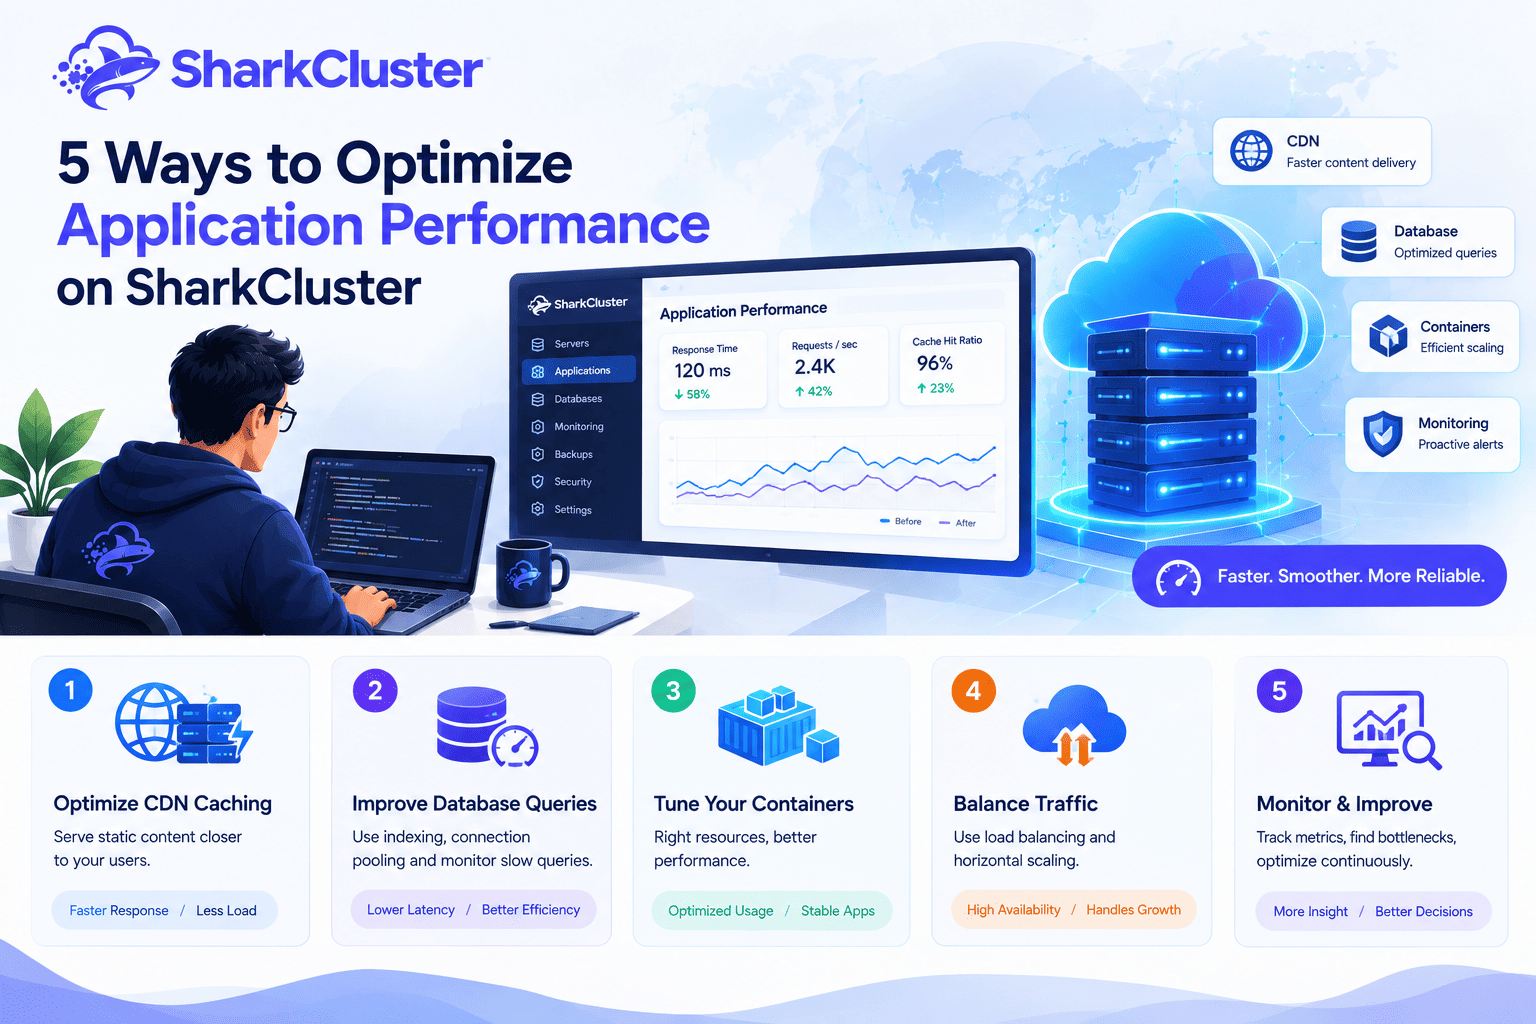
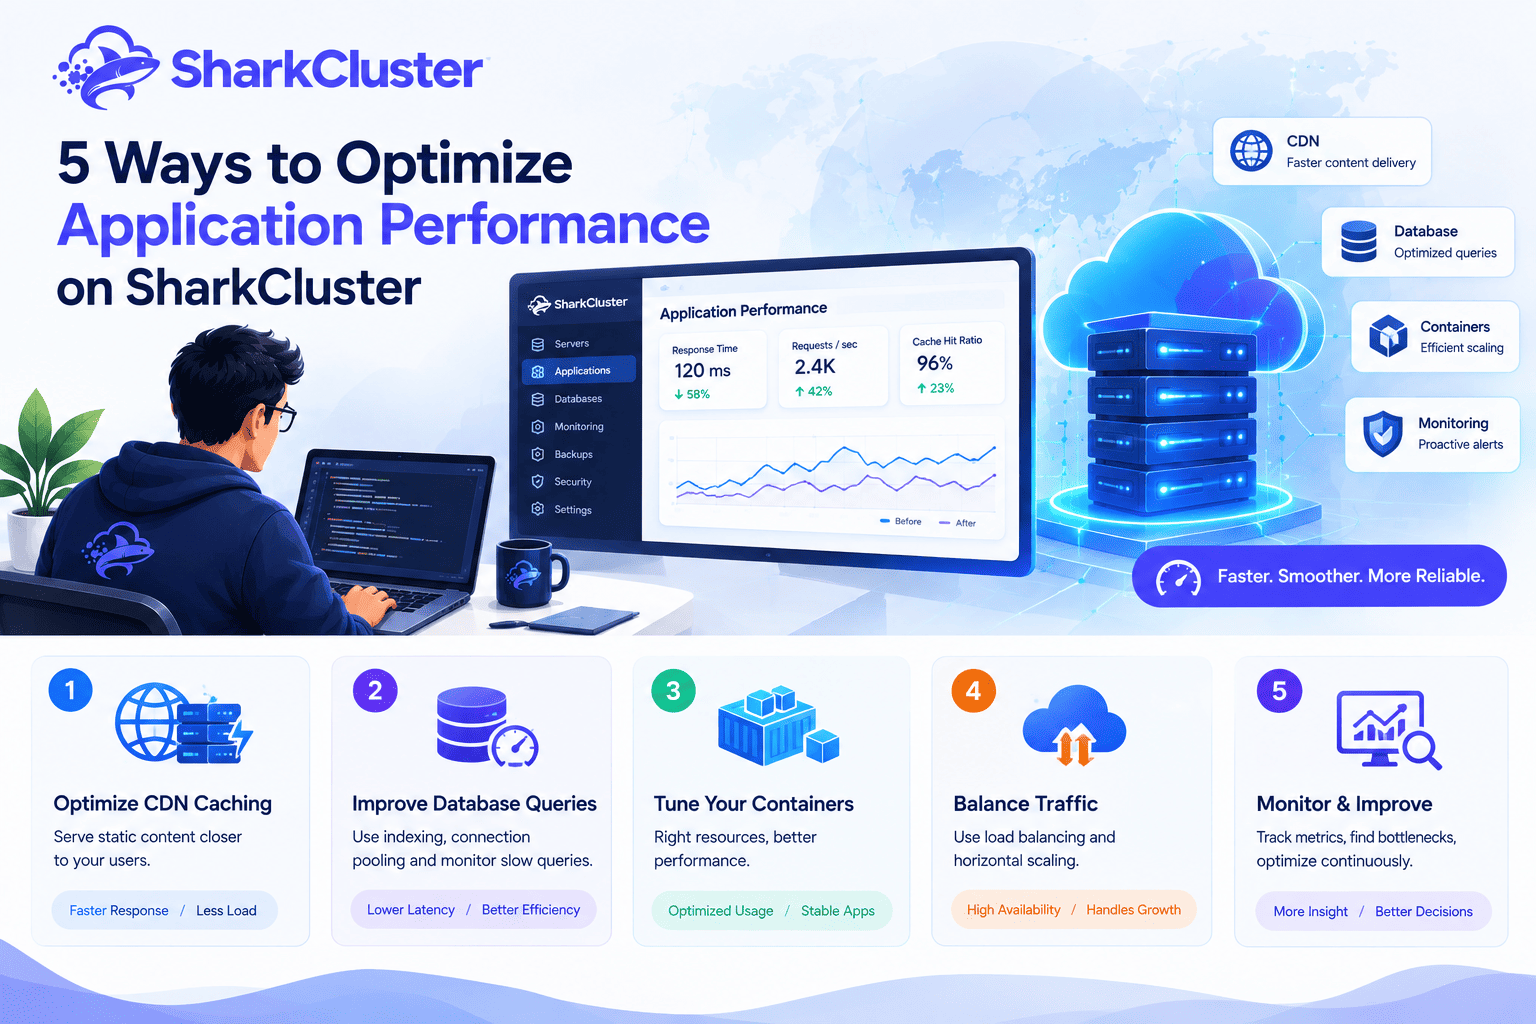
For developers and infrastructure teams, there is no one-size-fits-all approach to application performance optimization. It requires looking at the complete application stack—from CDN caching and database queries to containers, traffic distribution, and application monitoring.
SharkCluster provides an infrastructure environment where these areas can be managed and optimized from a centralized platform.
In this guide, we'll explore five practical ways to improve application performance on SharkCluster.
1. Optimize Your CDN Caching Strategy
A Content Delivery Network (CDN) reduces the distance between your users and frequently requested application assets. Cached content can be served from an edge location that is closer to the visitor, avoiding the need for each request to return to your origin server.
This is especially useful for:
- Images and media
- JavaScript and CSS files
- Fonts
- Static HTML pages
- Public API responses that are safe to cache
- Other static application resources
Configure caching carefully
Not every resource should have the same cache policy.
Static assets with versioned filenames can generally use longer cache lifetimes. For example:
/app.js?v=2026-10
/styles.css?v=2026-10
When the application changes, the version can change and force browsers and edge caches to retrieve the new resource.
Dynamic content should use more conservative caching rules. Pages containing user-specific information, authentication data, shopping carts, or other private information should generally not be publicly cached.
SharkCluster caching best practices
When configuring your application on SharkCluster:
- Identify your static resources.
- Enable appropriate caching for those resources.
- Use cache-control headers consistently.
- Avoid caching authenticated or user-specific responses publicly.
- Use cache invalidation when deploying important changes.
- Monitor origin traffic after enabling caching.
The goal is not simply to maximize cache duration. The goal is to serve repeatable content efficiently without returning stale or private data.
Measure the impact
Compare performance before and after caching by monitoring:
- Time to first byte (TTFB)
- Origin request volume
- Cache hit ratio
- Page load time
- Server CPU usage
- Network bandwidth
Improved response times for cacheable resources should come from a successful caching strategy that reduces the number of unnecessary requests reaching the application server.
2. Optimize Queries in the Database
Your application can have powerful servers and still feel slow if its database queries are inefficient.
Even if a page appears straightforward to the user, it could actually be processing dozens or hundreds of database queries in the background.
Identify slow queries
Start by finding queries that consume the most time.
Look for:
- Queries with high execution time
- Repeated queries
- Full-table scans
- Large result sets
- Missing indexes
- Inefficient joins
- N+1 query patterns
For example, this query may become expensive as a table grows:
SELECT *
FROM orders
WHERE customer_id = 12345;
If customer_id is frequently used for filtering, an appropriate index can significantly reduce the amount of data the database needs to scan.
Build an indexing strategy
Indexes should be based on actual query patterns rather than added randomly.
Review columns commonly used in:
WHERE
JOIN
ORDER BY
GROUP BY
However, indexes also consume storage and can increase the cost of write operations. Instead of simply adding more indexes, the goal is to create useful indexes.
Use connection pooling
Overhead is added by creating a new database connection for each request.
Connection pooling allows applications to reuse established database connections.
Your pool configuration should match your application's workload and database capacity. Too few connections can create a bottleneck, while too many can overwhelm the database.
Monitor Database Performance
SharkCluster's server and application monitoring capabilities can help you correlate application behavior with infrastructure usage.
When investigating slow requests, don't look only at CPU utilization. Compare:
- Application response time
- Database response time
- CPU usage
- Memory usage
- Connection counts
- Disk activity
- Request volume
This helps determine whether the database is actually the bottleneck or whether the problem exists elsewhere in the application stack.
3. Right-Size Container Resources
Although containerized applications make deployment and scaling simpler, improper resource assignment can reduce performance.
A container with insufficient CPU or memory can impede performance. On the other hand, giving each container too many resources can make infrastructure costs go up without actually improving performance.
Start with actual usage
Keep an eye on how much resources your application uses during low and high traffic.
Look for:
- CPU saturation
- Memory pressure
- Out-of-memory events
- Container restarts
- CPU throttling
- Increasing response times during traffic spikes
If memory usage consistently approaches the container limit, increasing the memory allocation may be appropriate.
If CPU usage is consistently saturated, additional CPU resources or application-level optimization may be necessary.
Horizontal versus vertical scaling
Vertical scaling means giving an existing workload more resources.
For example:
2 CPU / 4 GB RAM
 ↓
4 CPU / 8 GB RAM
This is straightforward and can work well for applications that are difficult to distribute.
Horizontal scaling means running multiple application instances.
For example:
 Load Balancer
 / | \
 App 1 App 2 App 3
Horizontal scaling has the potential to offer greater resilience and capacity, particularly for stateless applications.
Balance cost and performance
The most powerful server is not always the best option.
Before increasing the capacity of the infrastructure, make sure that the application is not actually resource-bound.
A slow API caused by inefficient database queries will not necessarily become fast simply because you double the CPU allocation.
Use monitoring data to determine whether you should:
- Optimize the application
- Increase container resources
- Add application instances
- Improve database performance
- Introduce caching
4. Optimize the distribution of traffic and load balancing
Sending every request to a single server can cause a bottleneck as application traffic grows.
Load balancing distributes incoming traffic across multiple application instances.
What is a typical architecture like?
 Users
 |
 Load Balancer
 / | \
 App 1 App 2 App 3
 \ | /
 Database
Instead of one application instance handling every request, traffic can be distributed across available instances.
Configure health checks
A load balancer should know when an application instance is unhealthy.
A possible health-check endpoint would be:
GET /healthWhen the application is capable of serving traffic, the endpoint should only return a successful response.
Health screenings can assist in preventing requests from being routed to unhealthy or unavailable times.
Consider session persistence
Some applications store session state locally.
It's possible that the application won't locate the expected session data if a user starts a session on Application 1 and sends the next request to Application 2.
This is where session persistence—or better, centralized session storage—becomes important.
Instead of solely relying on local application memory, think about storing shared session data in an external datastore for scalable applications.
Determine the outcome.
After introducing load balancing, monitor:
- Requests per instance
- Response time
- Error rates
- CPU utilization
- Memory usage
- Instance health
- Traffic distribution
The goal is more than just adding more servers. The goal is to evenly distribute the workload while preserving application availability and consistent performance.
5. Use Application Profiling and Continuous Monitoring
What you can't measure, you can't optimize.
Application profiling helps identify exactly where execution time is being spent.
Depending on your application stack, you may need to investigate:
- Slow API endpoints
- Expensive functions
- Database calls
- External API requests
- Memory consumption
- Background jobs
- Queue processing
- Rendering performance
Locate the actual obstruction.
Suppose an API request takes 2 seconds.
Without profiling, you might assume the application server is slow.
Profiling may disclose:
API request: 2000 ms
Database query: 900 ms
External API: 700 ms
Application code: 300 ms
Network/overhead: 100 ms
The optimization priority becomes obvious.
Improving the 300 ms application-code section first would have a relatively small effect. Reducing the database and external API latency could produce a much larger improvement.
Track Application Performance Over Time
Performance optimization should not end after deployment.
Set up monitoring for important metrics such as:
- Average response time
- P95/P99 latency
- HTTP error rates
- CPU utilization
- Memory utilization
- Database latency
- Request throughput
- Container restarts
Performance alerts can notify your team when metrics move beyond acceptable thresholds.
This changes performance management from a reactive process into a continuous one.
Quick Wins Checklist
Not every performance improvement requires a large project.
5-minute optimizations
Start with quick improvements:
- Enable appropriate browser and CDN caching.
- Compress static assets.
- Remove unnecessary application logs.
- Review obvious slow API endpoints.
- Check whether containers are hitting CPU or memory limits.
- Remove unnecessary database queries from frequently accessed pages.
1-hour deep dives
For a more detailed investigation:
- Review slow database queries.
- Check missing or inefficient indexes.
- Analyze API response times.
- Review container CPU and memory utilization.
- Inspect application and server logs.
- Compare performance during normal and peak traffic.
Multi-day projects
Larger performance improvements may require:
- Database schema optimization
- Application code refactoring
- Introducing asynchronous processing
- Implementing distributed caching
- Horizontal application scaling
- Load-balancer configuration
- Reworking expensive API integrations
- Implementing automated performance testing within CI/CD
Prioritizing enhancements based on measured bottlenecks rather than assumptions is crucial.
Conclusion
Application performance optimization is a continuous process.
The fastest applications are not necessarily running on the most expensive infrastructure. Typically, they are constructed with effective traffic distribution, efficient application code, optimized databases, appropriate caching, appropriately allocated resources, and continuous monitoring.
With SharkCluster, you can approach optimization across the infrastructure stack:
- Improve CDN caching to reduce unnecessary origin requests.
- Optimize database queries to reduce backend latency.
- Right-size container resources to balance performance and cost.
- Distribute traffic with load balancing as application demand grows.
- Profile and continuously monitor applications to find bottlenecks before they become major issues.
Benchmark your application, identify the actual bottleneck, implement one targeted improvement, and evaluate the results before making significant changes to the infrastructure.
Ready to find out where your application is slowing down? To establish a baseline, schedule a performance audit to identify the SharkCluster deployment optimization opportunities with the greatest potential impact.
Better performance starts with better visibility—and the right optimization strategy.
Run this on your own VPS
Deploy servers and applications on infrastructure you own, managed from one panel — backups, caching, firewall and monitoring included.